Healthcare · AI business automation
A medical trainee with a good research idea can wait 12 to 18 months to publish it. Most never do.
AI clinical research automation, 12–18 months to weeks
This AI-powered clinical research platform takes a plain-English research question through to a publication-ready analysis. Nine specialised agents do the work, with a reproducible audit trail and no code written by the researcher.
- Client
- Built for medical trainees
- Sector
- Healthcare
- Stage
- Live in beta
- Build
- Multi-agent, 9 agents
- Stack
- Google Cloud + Claude
A $53bn field with a publication problem
Medical research runs on people trained to treat patients, not to run statistics. The data is not the bottleneck. Public databases like the CDC's NHANES hold decades of population health data ready to analyse. The process that turns that data into a finished study is what's broken.
Healthcare analytics market in 2024, projected to more than triple by the mid-2030s
Source: Market.us, 2024
Of medical student research projects never reach peer-reviewed publication
Source: Systematic review and meta-analysis (PMC)
Of medical students cite lack of statistical skills as a top barrier to research
Source: Barriers to undergraduate medical research, PMC (74.2%)
Idea to paper
Six stages between a question and a publication
Every published study runs through the same stages. A clinician without a data team is blocked at almost every one.
| Stage | Typical time | Where it stalls |
|---|---|---|
| 1. Research question development | Days to weeks | 71.4% struggle to choose a topic |
| 2. IRB approval (where needed) | 2–4 months | Committee schedules |
| 3. Data collection and access | Days to 6 months | Database complexity |
| 4. Statistical analysis | 2–8 weeks | 74.2% lack the skills |
| 5. Writing and review | 2–4 weeks | Clinical duties compete |
| 6. Journal submission and review | 4–12+ months | Peer-review cycles |
Sources: barriers to undergraduate medical research, PMC (statistical skills 74.2%, topic selection 71.4%); medical-research publication rates, systematic review and meta-analysis.
The opportunity
The data is ready. The process isn't.#
Public datasets like NHANES, NHIS and MEPS hold decades of population health data, free to use. The barrier is everything between a question and a result: choosing the right statistical test, writing the SQL to pull the data, weighting the sample correctly, and producing code a reviewer will trust.
Take that off a clinician's plate and a study that took a year can take weeks. That was the brief: automate the whole workflow without lowering the bar a journal sets.
The data was never the problem. The work to turn it into a study was.
The hard part
Why this is hard to automate#
Automating research is not a chatbot on top of a database. Each step carries real methodological weight, and the output has to survive peer review.
Four walls in the way
Statistical method complexity
The platform has to pick the right test for the data and the question, identify confounders, weight complex survey designs and check the sample is large enough. Get it wrong and the study is worthless.
Authoritative data, made usable
Datasets like NHANES cannot be queried without SQL, survey-weighting knowledge and codebook navigation. The agents had to map plain questions onto real variables and pull the data correctly.
Methodology and reproducibility
Outputs have to follow PEO and PICO structures and meet journal standards like STROBE and CONSORT, with a complete audit trail and reproducible code.
Built for non-technical users
The people using it are clinicians, not data scientists. The interface had to take a plain-English question and explain its statistical choices, not assume training the user does not have.
The build
Built agent by agent, straight to production#
We skipped the throwaway prototype. Each of the nine agents was designed, tested against real research scenarios and integrated before the next went in, so the platform shipped as production-quality software from the start.
The orchestration runs on Claude Sonnet over LangChain, with each agent owning one decision in the workflow, from reading the question to validating the final output.
How it works
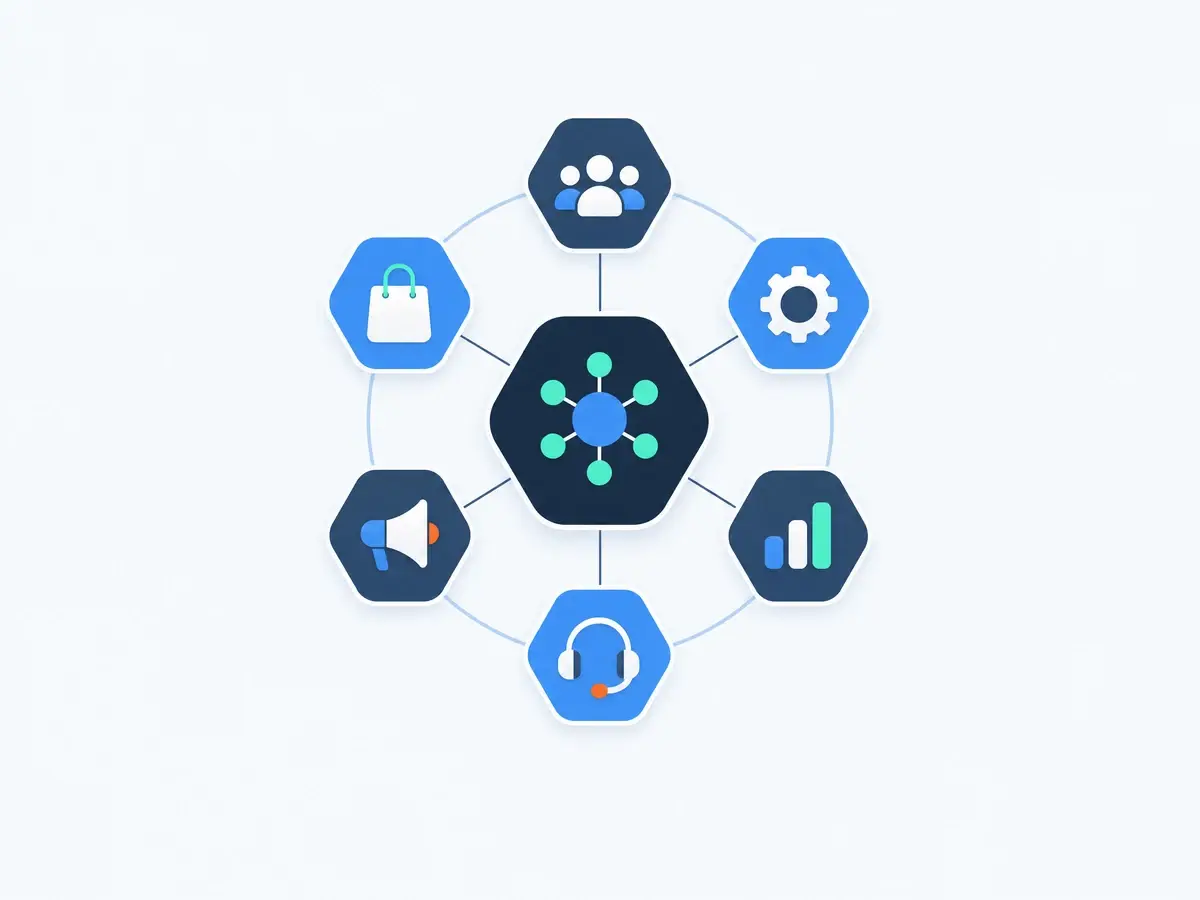
Nine agents, one orchestrator#
- 1
Research query
Reads a plain-English research question, detects its PEO/PICO structure and extracts the intent.
- 2
Feasibility
Checks the question against the available data: variable coverage, dataset fit and sample-size estimation.
- 3
Variable identification
Maps the study to the dataset codebook and suggests custom variables where they are needed.
- 4
Data extraction
Generates the SQL, queries BigQuery and applies the correct survey weighting, with no manual querying.
- 5
Statistical method
Selects the right tests, identifies confounders and builds the analysis plan.
- 6
Code generation
Produces reproducible, documented Python and R analysis code.
- 7
Context resolution
Handles multi-turn refinement, holding the whole study in context as the researcher iterates.
- 8
Report generation
Compiles the methods section, results tables and publication-ready formatting.
- 9
Validation
Runs quality and statistical-accuracy checks on every output before it reaches the researcher.
See it in action
From a question to a finished analysis
The researcher's journey, in four screens: explore the data, shape a question, define the cohort, then run the analysis.
Database exploration
Research question generation
Define the cohort
Primary analyses
Built with
- Cloud
- Google Cloud Platform · Cloud Run · Cloud SQL · Pub/Sub
- AI / ML
- Claude Sonnet · LangChain (multi-agent orchestration) · RAG
- Data
- BigQuery · NHANES / NHIS / MEPS public datasets
- Analysis
- Python · Pandas · Scikit-learn · Matplotlib
- Application
- React · TypeScript · FastAPI · REST API
- Security
- IAM · VPC · Encryption at rest and in transit
Results
What it delivers#
From question to publication-ready analysis
Specialised agents, one workflow
Lines of SQL or code the researcher writes
Reproducible, journal-aligned audit trail
Live, in beta
The platform is live with beta testers running real research questions. We are supporting users, watching how they work, and refining the agents on real-world queries.
Access widened
Medical students and early-career clinicians can run dataset-scale research without a statistician or a data team behind them.
Where else this works
The platform is built for clinical research. The method behind it is general: split an expert workflow into specialised agents, wire them to authoritative data, and keep the human in charge of the judgement.
Frequently asked questions
An automation of the whole clinical-research workflow. What used to be a six-stage manual process, from choosing a method and accessing the data through to running the statistics and writing up to publication standard, now runs as one pipeline of nine specialised AI agents. A researcher asks a question in plain English and gets back a publication-ready analysis with reproducible code.
It automates the slow stages: statistical method selection, querying public datasets through BigQuery with the right survey weighting, generating the analysis code, and drafting the methods and results. The researcher describes what they want to study; the agents do the data and statistical work that used to take months of specialist time.
No. The pipeline handles the SQL, the method selection and the code. The researcher works in plain English, and the platform explains its statistical choices as it goes, so the output is rigorous without assuming training the user does not have.
Every analysis follows PEO/PICO structure and journal reporting standards such as STROBE and CONSORT, with confounder handling and correct survey weighting. A validation agent runs quality and accuracy checks, and every study carries a fully reproducible audit trail and code.
Nine specialised agents orchestrated by Claude Sonnet over LangChain, querying public datasets (NHANES, NHIS, MEPS) through BigQuery on Google Cloud, with a Python analysis stack and a React front end.
No. The same method, splitting an expert workflow into specialised agents wired to authoritative data with a human in charge, applies to any field where rigorous analysis is gated behind scarce expertise.
Ready to turn an expert workflow into a platform?
If your field gates good work behind scarce expertise, that is what we automate. Book a walkthrough of this build, or a discovery call on your own process.
Explore Other Projects
Discover more AI solutions delivering measurable results across industries